Pyston status update

A lot has happened for Pyston lately; here’s a brief update.

CMake Support

Daniel Agar has taken our hand-written Makefile and converted much of it to CMake.  Right now the two build systems live side-by-side, but the plan is (assuming everyone likes it) to switch over entirely to CMake.

There were some changes that affect the Makefile-based build; if you’re setting up a new environment you should be able to just follow the updated instructions.  If you have an existing environment, there’s a set of one-time steps you have to take:

$ git pull
$ mv src/Makefile.local Makefile.local
$ make clean
CMake will hopefully simplify our build process as well as improve our ability to support multiple platforms.

pypa Python Parser

Vinzenz Feenstra has contributed pypa, a new parser for Python.  A new parser is a sensitive issue, so it’s currently being run as part of our test suite but isn’t turned on by default.  If things continue to go well with it, we’ll switch over to it from our current parser.

Our existing parser shells out to CPython to do the parsing, which serializes the AST and sends it back to Pyston.  Not only is the process inelegant, but it incurs a pretty hefty overhead per file or expression we want to evaluate.  The new parser should help a lot, and also looks well-factored so it should be possible to use in other projects as well.

AST Interpreter

Marius Wachtler has written an AST interpreter for us, which has now replaced our old LLVM interpreter.  Our old tiering process was to convert all Python into LLVM IR, and then run that IR through various LLVM tiers (interpreter, -O0 compiler, -O3 compiler).  This worked fine, except that the main overhead in this process was converting the Python AST to LLVM IR.  With the AST interpreter, we can avoid this expensive process for the majority of our code.

AST interpreter diagrams
Old compilation flow
AST interpreter diagrams (1)
New compilation flow
The other selling point of the AST interpreter is that it will allow us to build “resume-at-any-point” functionality, which we need for our new tiering framework, which will in turn allow more aggressive speculations and optimizations.

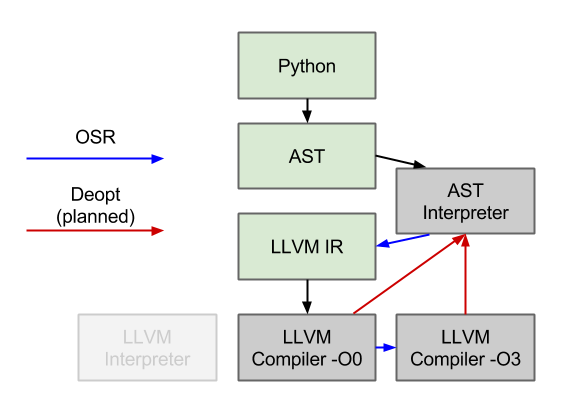
Currently, though, the new AST interpreter is slower to execute than the LLVM interpreter — which was surprising to me, since the LLVM IR is quite low level and not designed for interpretation.  The LLVM interpreter does have a few advantages, though: 1) it happens after (very simple) type specialization, which means that it is able to elide dynamic dispatches, and 2) the pointer-based SSA in the LLVM IR is faster to manipulate than the string-based Python AST.

Thankfully, the AST interpreter is significantly faster to start up, as we hoped.  Unfortunately though, for one of the cases we were hoping to improve (sre_parse._parse), the function ends up being hot enough to escape the interpreter and incur the compilation cost.  As future work, we need to improve the performance of the interpreter so that we can keep more code in it, and also lower the overhead of our compilation tier.

In the works

The rough goal for the rest of the year is to start doing well on the rest of the PyPy benchmark suite.  The are two main parts to that:

– Be able to run all the benchmarks, and
  • Be able to run them quickly.

On the compatibility side, we need to support one more language construct (exec) and a number of additional extension modules.

On the performance front, there are two main things we’re focusing on.  The first is reducing our startup time, much of which comes currently from sre_parse._parse (via “import optparse”).  The AST interpreter is key to this, as well as some other things we’re going to work on such as swapping the LLVM register allocator.

The other performance aspect we’re working on is better speculations.  We have all the parts we need now (AST interpreter and frame introspection) so we have started working on a new tiering framework that will let us speculate on events such as integer non-overflow.

Unrelated to any benchmarks, we are also trying to get Pyston running on OSX.  We have a branch that builds, runs through startup, and then segfaults somewhere.  I’m currently working on getting a working debugger on OSX to continue the porting.


So, things are still moving quickly, but there’s still a lot to do!  I’ve kept the Github issues list up to date with available projects and tasks, and I created a new tracker task that lists the various benchmarks that we don’t support yet as well as what we need to get them running.  Please feel free to dive into any of them or to send an email to pyston-dev@pyston.org with any questions.

Frame introspection in Pyston

We recently landed a new feature for Pyston: frame introspection, the ability to inspect the local variables of stack frames (usually but not always the current one).  There are a couple ways to directly make use of this feature from your Python code, such as the locals() method and the f_locals attribute on frame objects.  There are also some Python features that aren’t explicitly about locals but require them to be available, such as eval() and exec statements.  Finally, frame introspection is important for the JIT to be able to introspect its own stack frames to be able to support features such as deoptimization.  (I should mention that none of these features work yet since they all depend on the base frame introspection mechanism, which only just got added.)

In interpreters, it can be relatively easy to support frame introspection since you will typically have a runtime structure that corresponds to all of local variables that are defined — this is how our interpreter tier works and adding frame introspection there wasn’t that difficult.  For our compiled tier, we don’t have any such runtime structure: all the Python locals get converted to C-style locals and end up in registers or spilled onto the stack.  We want to be able to locate all of our variables without affecting runtime performance or code generation, and to achieve this we used some new features of LLVM.

Patchpoints

Pyston makes extensive use of LLVM’s new “patchpoint” intrinsic.  If you’re curious, the documentation does a very good job of explaining what they are, but in short they provide two separate but related features: the ability to runtime-patch your generated code (which we use for inline caches), and the ability to receive the locations of runtime values as determined by the LLVM code generator, via “stackmaps”.  We were already making extensive use of the first feature to do runtime code patching for various purposes (a future blog post, perhaps), and now we started using the stackmap feature.  Our approach is pretty straightforward: for every callsite that might ever need frame introspection — which is essentially all of them — we attach all the local variables as stackmap arguments, and LLVM will generate a stackmap that tells us where those variables live during that callsite.  Then at runtime, we interpret the stackmap and locate the variables.

As you can guess, the practice was slightly harder than the theory.  While patchpoints have been quite robust for us in their common use, using them for all callsites exposed a number of bugs or missing features in LLVM’s implementation.  The first is that they did not support LLVM’s exception handling mechanisms, which we use to for Python-level exceptions — we added this and it is now in LLVM trunk.  We also had to add support for returning doubles from patchpoints (patch pending) and ran into an issue where we can’t use LLVM’s “i1” type to represent booleans for now.  There are also some issues where LLVM will tell us that a value exists in a caller-save register, which we will have to save ourselves since they will get clobbered; there’s an ongoing discussion about how to resolve that.

After working through those issues, we were able to pass all of our local and temporary variables through the stackmap to the runtime and run the locals() method.  The next issue was that the LLVM compilation times were quite prohibitive.  A quick profile showed that the register allocator was responsible for almost all of the time; FTL (Apple’s LLVM JIT for JavaScript) uses a simpler register allocator, which might work for us, but we ended up addressing this a different way.  The problem comes from the fact that we attach all local and temporary variables to the patchpoint, but we only clear out dead temporary variables at the end of a basic block.  This means that if you have even a moderately-large basic block, you accumulate many temporary variables (roughly one per subexpression), leading to an O(N^2) LLVM IR representation.

To fix this, we now clear out temporary variables within a basic block.  It means that we have to do slightly more work during the analysis phase, but the result is that there is practically no increase in runtime cost from turning on frame introspection and the associated extra LLVM IR.

Future work

As of this post, we have a working implementation of frame introspection, and one can call the locals() variable.  Now we can go and implement some of the features that depend on it, such as eval() and exec — though those are tricky to model, since local variable updates by eval() can sometimes be seen by the outer scope and sometimes not.  Try guessing what this will print:

x = 1
def f():
    print map(eval, ["x", "locals().items()", "[x for x in xrange(5)]", "x", "locals().items()"])
    print x
f()

In addition to features that we want to build on top of this, there are a number of related optimizations we can do.  For example, LLVM currently generates a separate stackmap per callsite, but for our uses, there is a fair amount of overlap between the different generated stackmaps (a spilled register will stay in the same stack slot), so we can store these more efficiently by doing some simple compression of the stackmaps.  Our frame introspection also invalidates a number of optimizations that we used to do, since to the optimizer, every value will tend to immediately escape.  In the long run, this is something that we need to have, and it enables more optimizations than it breaks so we are excited to have it.


Side note: what about standard debug info

LLVM already has an established mechanism for transmitting the locations of user source variables: this is something that any debugger will want of any language.  LLVM has a series of intrinsics that can encode this information, which flow through the code generator and end up being emitted as DWARF, the standard debug info format that (for example) GDB will read.  At first, it seems like a natural fit — we’re trying to do exactly what debug info is meant to do.  LLVM has pretty good support for debug info (as good as clang’s is), and it solves a number of problems for us such as the efficient encoding of variable locations in addition to hooking us into a widely used standard.

We tried going down that road with little success.  The problem is that Python has the requirement that all variables are always available through frame introspection.  If you’ve ever used GDB on an optimized program and seen something like “(value optimized out)”, you know that normal C/C++ debugging systems don’t guarantee this.  The problem is that guaranteed debug info can inhibit optimizations or cause extra work, and a very reasonable requirement of debug info is that the debug-enabled version has exactly the same code as the non-debug version.  So LLVM does enforce a strict requirement, but unfortunately one that is opposite from our needs: they guarantee that they will not do any extra work to make your debug info available.  Darnit.

One unfortunate conclusion of “not being able to use a non-pessimizing debug info scheme” is that our patchpoint approach does in fact hurt optimizations — by attaching the local variables to all callsites, we force variables to be live and computations to happen at certain points.  For instance, most static compilers for languages like C/C++ will optimize away dead definitions like “x = 7”, since there is no way to observe that they occurred.  In Python, unfortunately, a dead definition is observable since one can simply look at the locals and see it; in our approach, this translates to LLVM seeing that the variable being referenced by a patchpoint.  There are a number of ways we can reduce this penalty, such as by “materializing” the values at the time of frame introspection instead of constructing them eagerly at runtime.  We’ll keep an eye on this behavior and see how much such optimizations are necessary; my guess is that relatively little time is spent executing trivially-dead statements.