Pyston 0.6 released

We are excited to announce the v0.6 release of Pyston, our high performance Python JIT.

In this release our main goal was to reduce the overall memory footprint.  It also contains a lot of additional smaller changes for improving compatibility and fixing bugs.

Memory usage reductions

One of the big items which reduced memory usage was moving away from representing the interpreter instructions in a tree and instead storing them as an actual bytecode. Now, each instruction follows each other in memory and does not involve pointer-chasing.

We are also much more aggressive in freeing unused memory now. For example for very hot functions which we compiled using the LLVM JIT (our highest tier) we now free the code which the baseline JIT emitted earlier-on. Additional bigger improvements were accomplished by making our analysis passes more memory efficient and fixing a few leaks.

release_v06_mem
This is a chart compares the maximal resident set size of several 64bit linux python implementations (lower is better) on a machine with 32GB of RAM.

While max RSS is not a very accurate memory usage number for various reasons, like not taking into account that pages can be shared between processes and only measuring peak usage, we think it shows nevertheless a very useful insight about how much (up to 2x) Pyston 0.6 improved over 0.5.1.

While we are happy that we were able to reduce the memory usage quite significantly in a few weeks we are not yet satisfied with it and will spend more time on reducing the memory usage further and developing better tools to investigate it. We have several ideas for this – some of the bytecode related ones are summarized here.

Additional changes

This release contains a lot of fixes for compatibility issues and other bugs.  We also spent time on making it easier to replace CPython with Pyston, such as by more closely matching its directory structure and following its ‘dict’ ordering.  We can now, for example, run pip and virtualenv unmodified, without requiring any upstream patches like other implementations do.

Aside: NumPy performance

NumPy hasn’t been a priority for us, but from time to time we check on how well we can run it.  We’ve focused on compatibility in the past, but for this post we took a look into performance as well.  We don’t have any NumPy-specific optimizations, so we were happy to see this graph from PyPy’s numpy benchmark runner:

download

As you can see, we closely match CPython’s performance on NumPy microbenchmarks, and are able to beat it on a few of the smaller ones.  Our current understanding is that we are doing better on the left two benchmarks because they run much more quickly — in about 1000x less time than the right three.  These shorter benchmarks spend a significant amount of time transitioning into and out of NumPy, which Pyston can help with, whereas the right three benchmarks are completely dominated by time inside NumPy.

As a side note, we the Pyston team don’t want to be in the business of picking what NumPy workloads are important.  If you have a program that you think shows real-world NumPy usage, please let us know because we would love to start benchmarking real programs rather than simple matrix operations.

Final words

As always, you can check out our online speed center for more details on our performance and memory usage.

We would like to thank all our open source contributors who contributed to this release, and especially Nexedi for their employment of Boxiang Sun, one of our core contributors.

  • Dong-hee Na
  • Krish Munot
  • Long Ang
  • Lucien Chan
  • SangHee Lee

Pyston 0.5.1 released

We are excited to announce the v0.5.1 release of Pyston, our high performance Python JIT.
This minor release passes all SciPy tests and is on average about 15% faster than 0.5.0. In addition several bug fixes and compatibility improvements got merged.

Performance related changes:

We released recently a blog post about our baseline JIT and inline caches. This release brings a lot of improvements in this area, some of the changes are:

  • the number of ICs slots is now variable. Before we specified for every IC how many slots it has and how large they should be (all slots in a IC had the same size). This often led to higher memory usage than necessary. We changed it now to a fixed size of memory which will than get filled with variable size slots whenever a new slot is required and there is space left in the IC. In addition this makes our IC size estimates in the LLVM tier more accurate because they are now based on the number of bytes we required in the bjit tier.
  • the interpreter reuses the stack slots (internally called vregs) assigned to temporary values which are only live in a basic block. This reduces stack usage which saves memory and made Pyston faster.
  • better non null value tracking, stack spilling, duplicate guard removal and much more temporary values will get held in registers
  • the bjit and ICs can now use callee-save register which removes a lot of spilling around calls
  • added a script which allows to inspect jited code directly from `perf report`.
    • usage with `make perf_<testname>`
  • our codegen and analysis passes now work on the vreg numbers which allows us to use arrays as internal data structures instead of hash tables which makes the code easier to understand and faster
  • faster reference counting pass in the code generator of the LLVM tier

Performance comparison:

startup performance benchmarks:

startup

This benchmarks show that the startup time improved significantly. Part of this comes from the numerous bjit improvements mentioned above (the chart also contains a direct comparison between the bjit performance of the different releases).

steady state benchmarks:

steadystate

Conclusion:

There are still a lot of low hanging fruit and we still have a huge amount of ideas for (performance) improvements for future releases.
The next months we will use to make Pyston ready for usage at dropbox – this is going to be very exciting 🙂

Finally, we would like to thank all of our open source contributors who have contributed to this release, and especially Nexedi for their employment of Boxiang Sun, one of our core contributors who helped greatly with the SciPy support.

  • Cullen Rhodes
  • Long Ang
  • Lucien Chan


baseline jit and inline caches

Creating an implementation for a dynamic language using just in time compilation (JIT) techniques involves a lot of compromises mainly between complexity of the implementation, speed, warm-up time and memory usage.
Especially speed is a difficult trade-off because it’s very easy to end-up spending more time optimizing a piece of code and emitting the assembly than we will ever be able to save by executing faster than executing it in a less optimized way.
This causes most JIT language implementations to use an approach of different tiers – approaches to running the code and different amount of optimizations done depending on how often the specific piece of code gets executed. Thereby reducing the chance that more time will get spend transforming the code in to a more efficient representation than it would take to execute it in a less efficient representation.

baseline just in time compiler

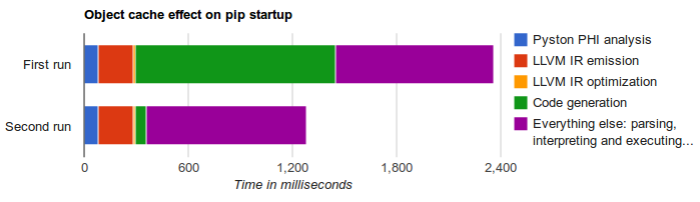
We noticed that our interpreter is interpreting code quite slowly while the LLVM tier takes a lot of time to JIT (even with the object cache which made it much faster) so it was obvious that we either have to speed the interpreter up or introduce a new tier in between.
There are well-known problems with our interpreter, mainly it’s slow because it does not represent the code in a contiguous block of memory (bytecode) but instead it involves a lot of pointer chasing because we reuse our AST nodes. Fixing this would be comparable easy but we still thought that this will only improve the performance a little bit but will not give us the performance we want.

About a year ago we introduced a new execution tier instead, the baseline jit (bjit). It is used for python code which is executed a medium number of times and therefore lives between the interpreter and the LLVM JIT tier. In practice this means most code which executes more than 25 times will currently end-up in the bjit and if it gets executed more than about 2500 times we will recompile it using the LLVM tier.

The main goal of the bjit is to generate reasonable machine code very fast and making heavy use of inline caches to get good performance (more on this further down).
It involved a number of design decisions (some may change in the future) but what we currently ended up with:

  • reuse our inline cache mechanism
    • it transform the bjit from only being able to remove the interpretation overhead (which is quite low for python – it depends on the workload but probably not more than 20%) to a JIT which actually is able to improve the performance by a much larger factor
  • generate machine code for a basic block at a time
    • only generating code for blocks which actually get executed reduces the time to generate code and memory usage at the expense of not being able to do optimizations across blocks (at the moment)
  • highly coupled to the interpreter and using the same frame format
    • making it very easy and fast to switch between the interpreter and bjit at every basic block start
    • we can fallback to the interpreter for blocks which contain operations which we are unable to JIT or for blocks which are unreasonable to JIT because the may be very large and generating code for them would cost too much memory
    • makes it easy to tier up to the bjit when we interpret a function which contains a loop with a large amount of iterations
  • does not use type analysis and all code it generates makes no assumptions about types
    • this makes it always safe to execute code in the bjit
    • type specific code is only inside the ICs and always contains a call to a generic implementation in case the assumptions don’t hold
  • all types are boxed / real python objects
  • it collects type information which we will use in LLVM tier to generate more optimized code later on if the function turns out to be hot
    • if an assumption in the LLVM tier turns out to be wrong we will deoptimize to the interpreter/bjit

Inline Cache

the inline cache mechanism is used in the LLVM tier and in the baseline JIT and is currently responsible for most of the performance improvements over the cpython interpreter (which does not use this technique). It removes most of the dynamic dictionary lookups and additional branching which a “normal” python interpreter often has to do. For every operation where we can use ICs we will provide a block of memory and fill it with a lot of nops and a call to the generic implementation of the operation. Therefore the first time we execute the code we will call into the generic implementation but it will trace the execution of the operation using the arguments supplied. It then fills in the block of memory a more optimized type specific version of the operation which we can use the next time we will hit this IC slot if the assumptions the trace made still hold.

Here is a simple diagram of how a IC with two slots could look like:

ic_example

A simple example will make it easier to understand what we are doing.

For the python function:

def f(a, b):
    return a + b

The CFG will look like this:

Block 0 'entry'; Predecessors: Successors:
 #0 = a
 #1 = b
 #2 = #0+#1
 return #2

We will now look at the IC for #2 = #0+#1

For example if we call f(1, 1) for the first time the C++ function binop() will trace the execution and fill in the memory block with the code to do an addition between two python int objects (it uses a C++ helper function called intAddInt()):

intAddInt

Notice the guard comparisons inside the first IC slot, they make sure that we will only use the more optimized implementation of the operation if it’s safe to do so (in this case the arguments have the same types and the types did not get modified since the trace got created) and otherwise jump to the next IC slot. Or if there is no optimized version call the generic implementation which is always safe to execute.

Most code is not very dynamic which means filling in one or two slots with optimized versions of a operation is enough to catch all encountered cases.
For example if we later on call f("hello ", "world") we will add a new slot in the IC:

strAddStr

We use ICs for nearly all operations not only for binary ones like the example showed. We also use them for stuff like global scope variable lookup, retrieving and setting attributes and much more (we also support more than two slots). Not all traces call helper functions like we have seen in the example some are inlined in the slot.

Pyston will overwrite slots if they already generated slots turn out to be invalid or unused because they assumption of the trace don’t hold anymore. Some code (luckily this is uncommon) is highly dynamic in this cases we will try to fill in the slot with a less aggressive version if possible – one which makes less assumption. If not possible we will just always call the generic version (like cpython always does).

The code we emit inside the ICs has similar trade offs to the bjit code – mainly it needs to get emitted very fast. We prefer generating smaller code instead of faster one because of the fixed size of the inline cache. It’s better to generate a smaller version which allows us to embed more slots if necessary and trashes the instruction cache less.

lots of ideas for improvements

Both the inline cache mechanism and the bjit have a lot of room for improvements. Some of the ideas we have are:

  • directly emit the content of some of the IC slots of the bjit in the LLVM tier as LLVM IR which makes it accessible to a powerful optimization pipeline which emits much better code with sophisticated inlining and much more
  • generating better representation for highly polymorphic sides
  • smarter (less) guards
  • introducing a simple IR which allows us to do some optimizations
  • better register allocation
  • allow tracing of additional operations
  • removal of unnecessary reference counting operations
  • the whole trace generation requires writing manual c++ code (called ‘rewriter’ inside the code base) which makes them quite hard to write but with the benefit of giving us total control of how a slot looks like. In the future we could try find a better trade-off by automatically generating them from the c++ code or LLVM IR when possible

We’ve already made a lot of improvements in this area, stay tuned for a 0.5.1 blog post talking about them 🙂

Caching object code

In this blog post I want to briefly describe a new feature which landed recently inside Pyston and which also touches one of the most often mentioned feedback we receive: A lot of people are under the impression that LLVM is not ready to be used as a JIT because of the main focus as a static compiler where fast code generation time is not as important as in the JIT usage.

While I agree that an LLVM JIT is quite expensive compared to baseline JIT tiers in other projects we expect to partly mitigate this and at the same time still take advantage of the good code quality and advanced features LLVM provides.

We observe that a lot of non benchmark code consists of dozens of functions which are hot enough that it makes sense to tier up to the LLVM JIT but the small amount it needs to JIT a single functions adds up and we spend a significant time JITing functions when starting applications. For example starting the pip (the package manager) takes currently about 2.3secs, from those we JIT 66 python functions which takes about 1.4secs. We noticed that from the 1.4secs JITing functions about 1.1secs are spend on optimizing and lowering the LLVM IR to machine code (instruction selection, register allocation, etc) and only a much smaller amount of time is spend generating the LLVM IR. We then thought that the best solution is to cache the generated machine code to disk in order to reuse it the next time we encounter the same function (e.g. on the next startup).

This approach is a little more complicated than just checking if the source code of a function hasn’t changed because we support type specializations, OSR frames and embed a lot of pointers inside the generated code (which will change). That’s why we choose (for now) to still generate the LLVM IR but after we generated it we will hash the IR and try to find a cached object file with the same hash.  To overcome the problem that the generated code is not allowed to contain pointers to changing addresses I changed Pyston to emit IR which whenever it encounters a pointer address (e.g. a reference to non Python unicode string created by the parser) generates a symbolic name (like an external variable) and remembers the pointer value in a map.

Here comes the advantage of using the powerful LLVM project to JIT stuff – it contains a runtime linker which is able relocate the address of our JITed object code. This means when we load an object we will replace the symbolic names with the actual pointer values, which lets us reuse the same assembly on different runs with different memory layouts.

Results

Object cache effect on pip startup
The result is that we cut the time to JIT the functions down to 350ms (was 1.4secs) of those merely 60ms are actually spend hashing the IR, decompressing and loading the object code and relocating the pointers (down from 1.1secs).

I think this is a good example of what quite significant performance enhancements can be made with a small amount of effort. There is a lot of room for improvements to this simple caching mechanism for example we could use it for a new ahead-of-time compile mode for important code (e.g the standard Python library) using a higher optimization level. While this change alone will not eliminate all of LLVMs higher JITing cost we are excited to implement additional features and performance optimizations inside Pyston.

If you are interested in more detailed performance statistics pass “-s” to Pyston’s command line and you will see much more output but you may have to look into the source code to see what every stat entry measures.