Pyston 0.5.1 released

We are excited to announce the v0.5.1 release of Pyston, our high performance Python JIT.
This minor release passes all SciPy tests and is on average about 15% faster than 0.5.0. In addition several bug fixes and compatibility improvements got merged.

Performance related changes:

We released recently a blog post about our baseline JIT and inline caches. This release brings a lot of improvements in this area, some of the changes are:

  • the number of ICs slots is now variable. Before we specified for every IC how many slots it has and how large they should be (all slots in a IC had the same size). This often led to higher memory usage than necessary. We changed it now to a fixed size of memory which will than get filled with variable size slots whenever a new slot is required and there is space left in the IC. In addition this makes our IC size estimates in the LLVM tier more accurate because they are now based on the number of bytes we required in the bjit tier.
  • the interpreter reuses the stack slots (internally called vregs) assigned to temporary values which are only live in a basic block. This reduces stack usage which saves memory and made Pyston faster.
  • better non null value tracking, stack spilling, duplicate guard removal and much more temporary values will get held in registers
  • the bjit and ICs can now use callee-save register which removes a lot of spilling around calls
  • added a script which allows to inspect jited code directly from `perf report`.
    • usage with `make perf_<testname>`
  • our codegen and analysis passes now work on the vreg numbers which allows us to use arrays as internal data structures instead of hash tables which makes the code easier to understand and faster
  • faster reference counting pass in the code generator of the LLVM tier

Performance comparison:

startup performance benchmarks:

startup

This benchmarks show that the startup time improved significantly. Part of this comes from the numerous bjit improvements mentioned above (the chart also contains a direct comparison between the bjit performance of the different releases).

steady state benchmarks:

steadystate

Conclusion:

There are still a lot of low hanging fruit and we still have a huge amount of ideas for (performance) improvements for future releases.
The next months we will use to make Pyston ready for usage at dropbox – this is going to be very exciting 🙂

Finally, we would like to thank all of our open source contributors who have contributed to this release, and especially Nexedi for their employment of Boxiang Sun, one of our core contributors who helped greatly with the SciPy support.

  • Cullen Rhodes
  • Long Ang
  • Lucien Chan


baseline jit and inline caches

Creating an implementation for a dynamic language using just in time compilation (JIT) techniques involves a lot of compromises mainly between complexity of the implementation, speed, warm-up time and memory usage.
Especially speed is a difficult trade-off because it’s very easy to end-up spending more time optimizing a piece of code and emitting the assembly than we will ever be able to save by executing faster than executing it in a less optimized way.
This causes most JIT language implementations to use an approach of different tiers – approaches to running the code and different amount of optimizations done depending on how often the specific piece of code gets executed. Thereby reducing the chance that more time will get spend transforming the code in to a more efficient representation than it would take to execute it in a less efficient representation.

baseline just in time compiler

We noticed that our interpreter is interpreting code quite slowly while the LLVM tier takes a lot of time to JIT (even with the object cache which made it much faster) so it was obvious that we either have to speed the interpreter up or introduce a new tier in between.
There are well-known problems with our interpreter, mainly it’s slow because it does not represent the code in a contiguous block of memory (bytecode) but instead it involves a lot of pointer chasing because we reuse our AST nodes. Fixing this would be comparable easy but we still thought that this will only improve the performance a little bit but will not give us the performance we want.

About a year ago we introduced a new execution tier instead, the baseline jit (bjit). It is used for python code which is executed a medium number of times and therefore lives between the interpreter and the LLVM JIT tier. In practice this means most code which executes more than 25 times will currently end-up in the bjit and if it gets executed more than about 2500 times we will recompile it using the LLVM tier.

The main goal of the bjit is to generate reasonable machine code very fast and making heavy use of inline caches to get good performance (more on this further down).
It involved a number of design decisions (some may change in the future) but what we currently ended up with:

  • reuse our inline cache mechanism
    • it transform the bjit from only being able to remove the interpretation overhead (which is quite low for python – it depends on the workload but probably not more than 20%) to a JIT which actually is able to improve the performance by a much larger factor
  • generate machine code for a basic block at a time
    • only generating code for blocks which actually get executed reduces the time to generate code and memory usage at the expense of not being able to do optimizations across blocks (at the moment)
  • highly coupled to the interpreter and using the same frame format
    • making it very easy and fast to switch between the interpreter and bjit at every basic block start
    • we can fallback to the interpreter for blocks which contain operations which we are unable to JIT or for blocks which are unreasonable to JIT because the may be very large and generating code for them would cost too much memory
    • makes it easy to tier up to the bjit when we interpret a function which contains a loop with a large amount of iterations
  • does not use type analysis and all code it generates makes no assumptions about types
    • this makes it always safe to execute code in the bjit
    • type specific code is only inside the ICs and always contains a call to a generic implementation in case the assumptions don’t hold
  • all types are boxed / real python objects
  • it collects type information which we will use in LLVM tier to generate more optimized code later on if the function turns out to be hot
    • if an assumption in the LLVM tier turns out to be wrong we will deoptimize to the interpreter/bjit

Inline Cache

the inline cache mechanism is used in the LLVM tier and in the baseline JIT and is currently responsible for most of the performance improvements over the cpython interpreter (which does not use this technique). It removes most of the dynamic dictionary lookups and additional branching which a “normal” python interpreter often has to do. For every operation where we can use ICs we will provide a block of memory and fill it with a lot of nops and a call to the generic implementation of the operation. Therefore the first time we execute the code we will call into the generic implementation but it will trace the execution of the operation using the arguments supplied. It then fills in the block of memory a more optimized type specific version of the operation which we can use the next time we will hit this IC slot if the assumptions the trace made still hold.

Here is a simple diagram of how a IC with two slots could look like:

ic_example

A simple example will make it easier to understand what we are doing.

For the python function:

def f(a, b):
    return a + b

The CFG will look like this:

Block 0 'entry'; Predecessors: Successors:
 #0 = a
 #1 = b
 #2 = #0+#1
 return #2

We will now look at the IC for #2 = #0+#1

For example if we call f(1, 1) for the first time the C++ function binop() will trace the execution and fill in the memory block with the code to do an addition between two python int objects (it uses a C++ helper function called intAddInt()):

intAddInt

Notice the guard comparisons inside the first IC slot, they make sure that we will only use the more optimized implementation of the operation if it’s safe to do so (in this case the arguments have the same types and the types did not get modified since the trace got created) and otherwise jump to the next IC slot. Or if there is no optimized version call the generic implementation which is always safe to execute.

Most code is not very dynamic which means filling in one or two slots with optimized versions of a operation is enough to catch all encountered cases.
For example if we later on call f("hello ", "world") we will add a new slot in the IC:

strAddStr

We use ICs for nearly all operations not only for binary ones like the example showed. We also use them for stuff like global scope variable lookup, retrieving and setting attributes and much more (we also support more than two slots). Not all traces call helper functions like we have seen in the example some are inlined in the slot.

Pyston will overwrite slots if they already generated slots turn out to be invalid or unused because they assumption of the trace don’t hold anymore. Some code (luckily this is uncommon) is highly dynamic in this cases we will try to fill in the slot with a less aggressive version if possible – one which makes less assumption. If not possible we will just always call the generic version (like cpython always does).

The code we emit inside the ICs has similar trade offs to the bjit code – mainly it needs to get emitted very fast. We prefer generating smaller code instead of faster one because of the fixed size of the inline cache. It’s better to generate a smaller version which allows us to embed more slots if necessary and trashes the instruction cache less.

lots of ideas for improvements

Both the inline cache mechanism and the bjit have a lot of room for improvements. Some of the ideas we have are:

  • directly emit the content of some of the IC slots of the bjit in the LLVM tier as LLVM IR which makes it accessible to a powerful optimization pipeline which emits much better code with sophisticated inlining and much more
  • generating better representation for highly polymorphic sides
  • smarter (less) guards
  • introducing a simple IR which allows us to do some optimizations
  • better register allocation
  • allow tracing of additional operations
  • removal of unnecessary reference counting operations
  • the whole trace generation requires writing manual c++ code (called ‘rewriter’ inside the code base) which makes them quite hard to write but with the benefit of giving us total control of how a slot looks like. In the future we could try find a better trade-off by automatically generating them from the c++ code or LLVM IR when possible

We’ve already made a lot of improvements in this area, stay tuned for a 0.5.1 blog post talking about them 🙂

Pyston 0.5 released

Today we are extremely excited to announce the v0.5 release of Pyston, our high performance Python JIT. We’ve been a bit quiet for the past few months, and that’s because we’ve been working on some behind-the-scenes technology that we are finally ready to unveil. It might be a bit less shiny than some other things we could have worked on, but this change makes Pyston much more ready to use.

Pyston is now using reference counting.

Refcounting

Reference counting (“refcounting”), is a form of automatic memory management. It’s usually viewed as slower and less sophisticated than using a tracing garbage collector (a “GC”), the predominant technique in modern languages. All past versions of Pyston contained tracing garbage collectors, and much of our work from 0.4 to 0.5 was tearing it out in favor of refcounting.

Why did we do this? In short, because CPython (the main Python implementation) uses refcounting. We used a GC initially to try to get more performance. But applying a tracing GC to a refcounting C API, such as the one that Python has, is risky and comes with many performance pitfalls. And most challengingly, Pyston wants to support the large amount of code that has been written that relies on the special properties that refcounting provides (predictable immediate destruction). We found that we had to go to greater and greater lengths to support these programs, and there were also cases where we wouldn’t be able to support the applications in their current form.

So we decided to bite the bullet and convert to refcounting, with the goal of getting better application compatibility.

How did we do?

NumPy

We are very happy to announce: we can run NumPy, unmodified.

Specifically: on their latest release (v1.11), we run their entire test suite with one test failure, for which they’ve accepted our patch. For their latest trunk, we have three test failures. We do need to use a modified version of part of their build chain (Cython), and we are currently slower on the test suite than CPython.

Regardless, we are very happy with this result, especially because we will continue to improve both the compatibility and performance.

Other goodies

There are quite a few non-refcounting features that made it into this release as well:

  • Signal handling
  • Frame introspection of exited frames
  • Generator cleanup
  • Support for more C API functions, such as custom tracebacks
  • and many more small fixes than we can list here

These are a large part of our progress on NumPy, and they also help us run other tricky libraries such as py.test, lxml, and cffi. We’ve also greatly reduced the number of modifications that we maintain to the Python standard libraries and C extensions. Overall, refcounting was a big investment, but it’s bought us compatibility wins that we would have had a very hard time getting otherwise.

Performance

Unfortunately, since performance wasn’t our goal for this release, we did slide backwards a bit. v0.5 is about 10% slower than v0.4 was, largely due to the change to refcounting. We are okay with the regression since we explicitly focused on compatibility for the last six months, and our refcounting implementation still has many available optimizations.

As a side note, the “conventional wisdom” is that refcounting should have been even slower compared to using a GC.  We attribute this mainly to the compatibility restrictions that hampered our GC implementation.

There is a lot of low-hanging performance fruit available to us right now which we have been explicitly avoiding while we finished refcounting. Now would be a great time to consider contributing since we have more ideas than we can implement ourselves. This is especially true when it comes to NumPy performance.

Currently, we take about twice as long to run the NumPy test suite as CPython does. We don’t know how this will translate to performance on real NumPy programs, but we do know that much of the slowdown falls into two categories: the first is NumPy hits code paths that are otherwise-rare in Pyston and are currently unoptimized. The second is a bit more subtle: NumPy frequently calls from C code back into the Python runtime, which is expensive for us because it doesn’t benefit from our JIT (in addition to being previously-rare). We have techniques inside Pyston to handle these situations and invoke our JIT from C code, and we’d like to start exposing that so that NumPy and other libraries can use it.

Looking forward

We apologize — again — for the lengthy release cycle. We didn’t expect refcounting to take this long, and we even knew that it would take longer than we expected. We’re planning on doing another blog post to talk about what the difficulties were with it and go into more of the technical details of our refcounting system.

Moving forward, our plan for 0.6 is to focus on performance. We would love help from the community on identifying what is important to make performant. We could work on making the NumPy test suite fast, but it may not end up translating to real NumPy workloads.

We’re at the point that trying out Pyston should be easy; it won’t benefit all workloads, but it should be easy to drop it in and see if it does. To test it out, try

docker run -it pyston/pyston

or check out our readme for other options for obtaining Pyston.  To try NumPy, use the “pyston/pyston-numpy” image instead.

We have quite a few optimization ideas lined up, and the pressure has been strong to delay the 0.5 release “just one more week” so that we have time to include some of them. Expect to see an 0.5.1 release that improves performance.

Final words

Refcounting brings Pyston one step closer to being a drop-in replacement for CPython. There is still much more work to do, but we feel like with refcounting we’ve reached a threshold where we’d like to start getting Pyston into peoples’ hands. It’s still very much beta software, so there are many rough edges and unoptimized casses. But we want your feedback on what’s working and what’s not.

Finally, we would like to thank all of our open source contributors who have contributed to this release, and especially Nexedi for their employment of Boxiang Sun, one of our core contributors who helped greatly with the NumPy support.

  • Boxiang Sun
  • Dong-hee Na
  • Rudi Chen
  • Long Ang
  • @LoyukiL
  • Tony Narlock
  • Felipe Volpone
  • Daniel Milde
  • Krish Monut
  • Jacek Wielemborek

Pyston 0.4 released

For a list of common questions about our project, please see our FAQ.

We are very excited to release Pyston 0.4, the latest version of our high-performance Python JIT.  We have a lot to announce with this release, with the highlights of being able to render Dropbox webpages, and achieve performance 25% better than CPython (the main Python implementation) on our benchmark suite.  We are also excited to unveil our project logo:

A lot has happened in the eight months since the 0.3 release: the 0.4 release contains 2000 commits, three times as many commits as either the 0.2 or 0.3 release.  Moving forward, our plan is to release every four months, but for now please enjoy a double-sized release.

Compatibility

While not individually headline-worthy, this release includes a large number of new features:

  • Unicode support
  • Multiple inheritance
  • Support for weakrefs and finalizers (__del__), including proper ordering
  • with-statements
  • exec s in {}
  • Mutating functions in place, such as by setting func_code, func_defaults, or func_globals
  • Import hooks
  • Set comprehensions
  • Much improved C API support
  • Better support for standard command line arguments
  • Support for multi-line statements in the REPL
  • Traceback and frame objects, locals()

Together, these mean that we support almost all Python semantics.  In addition, we’ve implemented a large number of things that aren’t usually considered “features” but nonetheless are important to supporting common libraries.  This includes small things such as supporting all the combinations of arguments builtin functions can take (passing None as the function to map()) or “fun” things such as mutating sys.modules to change the result of an import statement.

Together, these new features mean that we support many common libraries.  We successfully run the test suites of a number of libraries such as django and sqlalchemy, and are continually adding more.  We have also started running the CPython test suite and have added 153 (out of 401) of their test files to our testing suite.

We also have some initial support for NumPy.  This isn’t a priority for us at the moment (our initial target codebase doesn’t use NumPy), but we spent a small amount of time on it and got some simple NumPy examples working.

And most importantly, we now have the ability to run the main Dropbox server, and can render many of its webpages.  There’s still more work to be done here — we need to get the test suite running, and get a performance-testing regimen in place so we can start reporting real performance numbers and comparisons — but we are extremely happy with the progress here.

C API

One thing that has helped a lot in this process is our improved C API support.  CPython has a C API that can be used for writing extension modules, and starting in the 0.2 release we added a basic compatibility layer that translated between our APIs and the CPython ones.  Over time we’ve been able to extend this compatibility to the point that not only can we support C extensions, but we also support running CPython’s internal code, since it is written to the same API.  This means that to support a new API function we can now use CPython’s implementation of the function rather than implementing it on top of our APIs.

As we’ve implemented more and more APIs using CPython’s implementation, it’s become hard to continue thinking of our support as a compatibility layer, and it’s more realistic to think of CPython as the base for our runtime rather than a compatibility target.  This has also been very useful towards our goal of running the Dropbox server: we have been able to directly use CPython’s implementation of many tricky features, such as unicode handling.  We wouldn’t have been able to run the Dropbox server in this amount of time if we had to implement the entire Python runtime ourselves.

Performance

We’ve made a number of improvements to Pyston’s performance, including:

  • Adding a custom C++ exception unwinder.  This new unwinder takes advantage of Pyston’s existing restrictions to make C++ exceptions twice as fast.
  • Using fast return-code-based exceptions when we think exceptions will be common, either due to the specifics of the code, or due to runtime profiling.
  • A baseline jit tier, which sits between the interpreter and the LLVM JIT.  This tier approaches the performance of the LLVM tier but has much lower startup overhead.
  • A new on-disk cache that eliminates most of the LLVM tier’s cost on non-initial runs.
  • Many tracing enhancements, producing better code and supporting more cases
  • New CAPI calling conventions that can greatly speed up calling CAPI functions.
  • Converted some builtin modules to shared modules to improve startup time.
  • Added a PGO build, and used its function ordering in normal builds as well.

Conspicuously absent from this list is better LLVM optimizations.  Our LLVM tier has been able to do well on microbenchmarks, but on “real code” it tends to have very little knowledge of the behavior of the program, even if it knows all of the types.  This is because knowing the types of objects only peels away the first level of dynamicism: we can figure out what function we should call, but that function will itself often contain a dynamic call.  For example, if we know that we are calling the len() function, we can eliminate the dynamic dispatch and immediately call into our implementation of len() — but that implementation will itself do a dynamic call of arg.__len__().  While len() is common enough that we could special-case it in our LLVM tier, this kind of multiple-levels-of-dynamicism is very common, and we have been increasingly relying on our mini tracing JIT to peel away all layers at once.  The result is that we get good execution of each individual bytecode, but the downside is that we are currently lacking good inter-bytecode optimizations.  Our plan is to integrate the per-bytecode tracing JIT and the LLVM method JIT to achieve the best of both worlds.

Benchmarks

We updated our benchmarks suite to use three real-world libraries: our suite contains a benchmark based on each of pyxl, django, and sqlalchemy. Benchmark selection is a contentious topic, but we like these benchmarks because they are more typical of web servers than existing Python benchmark suites.

On these benchmarks, we are 25% faster than CPython (and 25% slower than PyPy 4.0.0).  We have a full performance tracking site, where you can see our latest benchmark results (note: that last link will auto-update over time and isn’t comparing the same configurations as the 25% result).

Community

We also have a number of exciting developments that aren’t directly related to our code:

  • We switched from a Makefile build system to a CMake-based one.  This lets us have some nice features such as a configure step, faster builds (by supporting Ninja), and down the road easier support for new platforms.  This was done by an open source contributor, Daniel Agar, and we are very thankful!
  • We have more docs.  Check out our wiki for some documentation on internal systems, or tips for new contributors.  Browsing the codebase should be easier as well.
  • We have a logo!
  • We had 184 commits from 11 open source contributors.  A special shoutout to Boxiang Sun, who has greatly helped with our compatibility!

Final words

We have a pre-built binary available to download on Github (though please see the notes there on running it).  Pyston is still in a pre-launch state, so please expect crashes or occasional poor performance, depending on what you run it on.  But if you see any of that, please let us know either in our Gitter channel or by filing a Github issue.  We’re excited to hear what you think!

If you are in the Bay Area, we are having a talk + meetup at the Dropbox SF office at 6:30pm on November 10th.  We only have a few spaces left, so please RSVP if you are interested.  More details at the RSVP link.

We have a lot of exciting things planned for our 0.5 series as well.  Our current goals are to implement a few final features (such as inspection of stack frames after they exit), to continue improving performance, and to start running some Dropbox services on Pyston.  It’s an exciting time, and as always we are taking new contributors!  If you’re interested in contributing, feel free to peruse our docs, check out our list of open issues, or just say hi!

Caching object code

In this blog post I want to briefly describe a new feature which landed recently inside Pyston and which also touches one of the most often mentioned feedback we receive: A lot of people are under the impression that LLVM is not ready to be used as a JIT because of the main focus as a static compiler where fast code generation time is not as important as in the JIT usage.

While I agree that an LLVM JIT is quite expensive compared to baseline JIT tiers in other projects we expect to partly mitigate this and at the same time still take advantage of the good code quality and advanced features LLVM provides.

We observe that a lot of non benchmark code consists of dozens of functions which are hot enough that it makes sense to tier up to the LLVM JIT but the small amount it needs to JIT a single functions adds up and we spend a significant time JITing functions when starting applications. For example starting the pip (the package manager) takes currently about 2.3secs, from those we JIT 66 python functions which takes about 1.4secs. We noticed that from the 1.4secs JITing functions about 1.1secs are spend on optimizing and lowering the LLVM IR to machine code (instruction selection, register allocation, etc) and only a much smaller amount of time is spend generating the LLVM IR. We then thought that the best solution is to cache the generated machine code to disk in order to reuse it the next time we encounter the same function (e.g. on the next startup).

This approach is a little more complicated than just checking if the source code of a function hasn’t changed because we support type specializations, OSR frames and embed a lot of pointers inside the generated code (which will change). That’s why we choose (for now) to still generate the LLVM IR but after we generated it we will hash the IR and try to find a cached object file with the same hash.  To overcome the problem that the generated code is not allowed to contain pointers to changing addresses I changed Pyston to emit IR which whenever it encounters a pointer address (e.g. a reference to non Python unicode string created by the parser) generates a symbolic name (like an external variable) and remembers the pointer value in a map.

Here comes the advantage of using the powerful LLVM project to JIT stuff – it contains a runtime linker which is able relocate the address of our JITed object code. This means when we load an object we will replace the symbolic names with the actual pointer values, which lets us reuse the same assembly on different runs with different memory layouts.

Results

Object cache effect on pip startup
The result is that we cut the time to JIT the functions down to 350ms (was 1.4secs) of those merely 60ms are actually spend hashing the IR, decompressing and loading the object code and relocating the pointers (down from 1.1secs).

I think this is a good example of what quite significant performance enhancements can be made with a small amount of effort. There is a lot of room for improvements to this simple caching mechanism for example we could use it for a new ahead-of-time compile mode for important code (e.g the standard Python library) using a higher optimization level. While this change alone will not eliminate all of LLVMs higher JITing cost we are excited to implement additional features and performance optimizations inside Pyston.

If you are interested in more detailed performance statistics pass “-s” to Pyston’s command line and you will see much more output but you may have to look into the source code to see what every stat entry measures.

Pyston 0.3: Self-hosting Sufficiency

We’ve been working hard over the past five months and are very happy to release Pyston 0.3, the newest version of our high-performance Python implementation. The biggest features of this release are that we can now run all of our internal scripts on Pyston, as well as improved performance.  We also have some exciting news to share about our project status and plans.

Language compatibility

Self-hosting, or running a compiler through itself, is one of the best ways to demonstrate language compatibility. Pyston isn’t a static compiler or written in Python, so “self-hosting” is a bit of a misnomer / attention grabber, but we still have a number of internal Python scripts of various complexity, and with this release we can now run them all on Pyston. The most complex of our scripts is our test runner, which spawns multiple threads, spawns subprocess to run the tests, calls pickle to load the expected results, and reports back to the user. In the process it executes a few thousand lines of code across a few dozen standard libraries and extension modules.

Unfortunately, we make fairly little use of our self-host ability at the moment.  We only have a single Python script that’s actually involved in the building of Pyston and even then only tangentially.  And we can’t default to running our tester in self-host mode, since what if we have a bug that breaks the test runner and makes all the tests pass?  But at least we have the ability.

For some quantitative stats of debatable value, we can look at how many of the Python standard libraries and extension modules we can import.  (Note: this is just importing the library correctly, not testing any of its functionality beyond that.  Hopefully in the 0.4 release we can say how many of the CPython test cases we can pass.)  At the time of our 0.2 release, we were able to import 56 top-level standard libraries, and 12 standard extension modules.  Now, with the 0.3 release, we are able to import 117 libraries and 27 extension modules, which is more than twice as many.

We still have a long way to go, though, since this is only about half of the libraries and extension modules in CPython (though we don’t have to support all of them immediately).  Thankfully, our C API support is becoming fairly developed, and while it was originally intended for supporting C extension modules, it works just as well to support CPython’s internal code.  We’ve gotten to the point that we can often copy large swaths of code from CPython into Pyston without modification, and while it’s hard to measure, I think we currently compile about as much CPython code into Pyston as code that we wrote ourselves.  So without really intending it, we’ve been adopting a “CPython with a replaced core” architecture and been moving away from the “completely from scratch” model we started with.  Regardless of whether we fully adopt that strategy or not, we’re currently able to use large amounts of implementation from CPython and move much faster.

Performance

We were hesitant to announce performance numbers in the 0.1 and 0.2 releases, since both of those releases focused on longer term investments (getting the core infrastructure in place, and language features, respectively) from which we didn’t want to get distracted.  In the past month or so, though, we’ve finally taken the time to go back and expand our benchmark suite and fix some of the low hanging fruit that we skipped during initial implementation, and are happy to talk about how we’re doing. The result is that we are now (on our small benchmark suite) faster than CPython!  We are currently 1% faster than CPython using a geometric mean, with individual benchmarks varying between 2x faster and 2x slower.  You can see more details and up-to-date benchmark results at speed.pyston.org.  (A hearty thanks to the PyPy team for the performance tracking software.)

“1% faster than CPython” is clearly not our overall performance target, but we are happy with the speed at which we got here, and the amount of optimization headroom we still have.  Moving forward, we could continue working on optimizations and have more impressive benchmark results, but we’re taking this milestone as a signal that we should shift focus back to feature work again.

If we were to break down our performance versus CPython, we (unsurprisingly) have better steady-state performance but worse startup time.  As a quick measure of how our benchmark suite balances the two, the benchmark geomean has a value of 6.0 seconds; it’s hard to tell if this is the same balance as for our target server workloads.

  • Most of our startup time comes from LLVM jitting our code.  This doesn’t mean that LLVM is to blame: our AST interpreter is fairly slow, requiring us to often tier out of it to our LLVM JIT.  We also generate some very large LLVM IR in order to support our frame introspection, which slows down compilation times.  We have a number of ideas on how to improve startup time on both these fronts (make LLVM jit quicker, and go to it less).
  • For steady-state performance, we tend to do well at executing our JIT’ed code, but our memory system — though much better than it was in 0.2 — is still not as good as CPython’s or other implementations’.  Most of our speedup comes from our inline caching mechanisms, and we still have a lot of open headroom for more type speculations and LLVM optimizations, since we do almost none of either.

Project plans

On the project management side, we now have multiple people working full time on the project, in addition to the part-time help we’ve been getting!  With the additional resources we’ve been able to move more quickly (you can see an uptick in GitHub commits), and we’ve set some aggressive goals for running Dropbox on Pyston.  We’re very excited about how much we’re going to be able to get done.

Our goal moving forward is to continue expanding the fraction of the language+runtime that we support, and maintain certain performance targets as we go.  Our current performance target is 1x CPython, but we may loosen it in order to prioritize feature work, since that tends to be more time-sensitive (blocks more things) than performance work.  We’ll be targeting larger and larger applications to run under Pyston, with the ultimate target being the Dropbox server codebase.

Conclusion

As always, you can find our code on GitHub.  We’ve released a binary that may or not run on your system, but is available for you to play with if you’re interested — but remember that this is still an alpha and not ready for real use.  If you run into issues or would like to contribute, please let us know!

Python benchmark sizes

I’ve always been an advocate for new benchmarks for Python: the PyPy benchmark suite is good, but I’ve always felt that it misses certain real-world features.  Benchmark-picking seems to always be a contentious issue with different people defining “real world features” in different ways (take a look at the JavaScript benchmark situation), but I’ve always felt that the existing Python benchmarks are pretty micro-benchmark-y — which is not necessarily a bad thing, but we as a community might benefit from having larger macrobenchmarks.  I’ve debated with people about the characteristics of the PyPy benchmark suite (especially the “Django macrobenchmark”), so I decided to write a tool to collect some numbers.

The goal of the tool is to get an understanding of how much code is important to the benchmark: specifically, how many lines of code cover 99% of the execution time of the benchmark.  There are many possible statistics that we can gather that would be meaningful, but I chose this one as a rough measure of the amount of hot code in the benchmark.  This is an admittedly crude heuristic — it is dependent on the implementation used to run it (Python 2.7.6 for these results), and has all of the flaws that come with using lines-of-code to measure anything.  Still, I think it can still be useful as a rough starting point for talking about the sizes of our benchmarks.

The tool works by attaching a sampling profiler to the benchmark, noting the line number that was active at the time of the sample, and at the end tallying the most common lines until we have reached 99% of the total number of samples.  I ran the tool over the PyPy benchmark suite and got these results, in “lines of code that comprise 99% of the runtime”:

(Update: I reran the benchmarks to more closely match the way they get reported by PyPy, so the numbers have changed.  See the next section for details.)

  • ai: 12
  • chaos: 78
  • django: 72
  • fannkuch: 16
  • float: 19
  • meteor-contest: 17
  • nbody_modified: 17
  • richards: 99
  • rietveld: 759
  • slowspitfire: 4
  • spambayes: 316
  • spectral-norm: 6
  • spitfire_cstringio: 6
  • telco: 194
  • twisted_iteration: 97
  • twisted_names: 613
  • twisted_pb: 387
  • twisted_tcp: 137
  • (geomean):  36

For reference, my icbd static type inferencer measures in at 1268 lines of code for 99% coverage — it’s a poor benchmark in many ways (non-determinism for one), but this metric suggests that at least along this dimension, it has quite different behavior than the most of the benchmarks in the PyPy benchmark suite.  Again, I’m not trying to say that a small benchmark is necessarily bad or that a large benchmark is necessarily good, but just that we may need more variety in our benchmarks to capture the behavior of different types of programs.  I’m glad to see that there are some larger benchmarks in the PyPy suite, though I think there’s still some room to improve, since they get outnumbered by the smaller benchmarks (the geometric mean is still quite low).

[Update] Some notes on methodology

I picked the 20 benchmarks that PyPy lists on the front page of their Speed Center, which are the benchmarks that they seem to base their published numbers on.

To try to closely match their environment, I modified the benchmark suite’s “runner.py” to output the commands it runs rather than actually run them; in the previous version of this post I just ran the benchmarks with their default arguments.

The PyPy benchmark suite only reports peak performance, and ignores any initialization or warmup time, so I modified the measure_loc tool to ignore those as well.

[Update] Secondary benchmarks

PyPy has a number of benchmarks that they don’t include in their primary benchmark set (the one they use to compare to CPython), but are available in their repository for use.

  • sympy_sum: 244
  • sympy_expand: 148
  • sympy_integrate: 628
  • sympy_str: 513
  • translate: 5805*
  • = with a tracing profiler.  The translate program isn’t signal-safe or easily made to be so, so I have to run it under a tracing profiler.  The tracing profiler is much more invasive and it’s not clear how the numbers compare; they seem to usually be 0-30% higher than the sampling profiler.

Trying it yourself

The tool has been pushed to the Pyston repository, and I’ve tried to make it user-friendly: just run “python measure_loc.py your_script.py your_script_args” or “python measure_loc.py -m your_module your_module_args” and it will spit out some results at the end.  I’d be interested to hear what kinds of results people get with other benchmarks or runtimes, and I hope we can start a discussion that leads to some more comprehensive Python benchmarks.

Pyston status update

A lot has happened for Pyston lately; here’s a brief update.

CMake Support

Daniel Agar has taken our hand-written Makefile and converted much of it to CMake.  Right now the two build systems live side-by-side, but the plan is (assuming everyone likes it) to switch over entirely to CMake.

There were some changes that affect the Makefile-based build; if you’re setting up a new environment you should be able to just follow the updated instructions.  If you have an existing environment, there’s a set of one-time steps you have to take:

$ git pull
$ mv src/Makefile.local Makefile.local
$ make clean
CMake will hopefully simplify our build process as well as improve our ability to support multiple platforms.

pypa Python Parser

Vinzenz Feenstra has contributed pypa, a new parser for Python.  A new parser is a sensitive issue, so it’s currently being run as part of our test suite but isn’t turned on by default.  If things continue to go well with it, we’ll switch over to it from our current parser.

Our existing parser shells out to CPython to do the parsing, which serializes the AST and sends it back to Pyston.  Not only is the process inelegant, but it incurs a pretty hefty overhead per file or expression we want to evaluate.  The new parser should help a lot, and also looks well-factored so it should be possible to use in other projects as well.

AST Interpreter

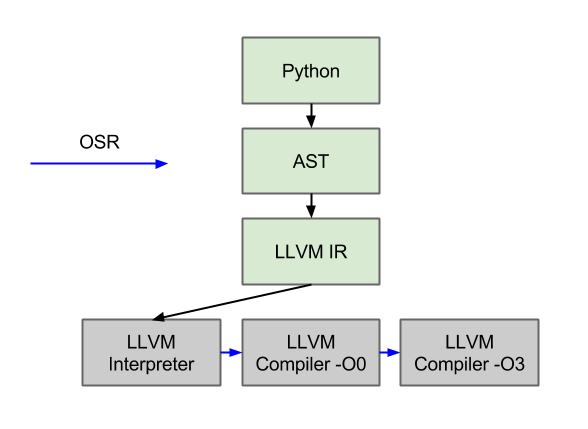
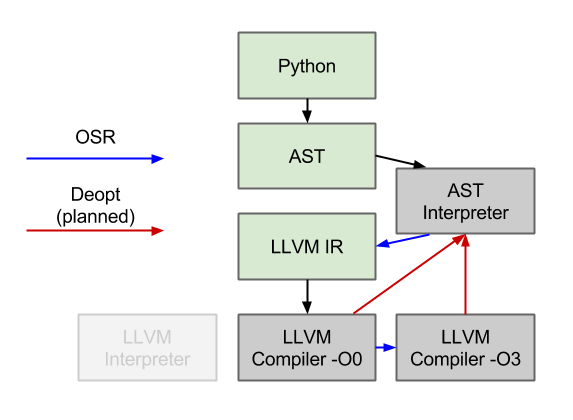
Marius Wachtler has written an AST interpreter for us, which has now replaced our old LLVM interpreter.  Our old tiering process was to convert all Python into LLVM IR, and then run that IR through various LLVM tiers (interpreter, -O0 compiler, -O3 compiler).  This worked fine, except that the main overhead in this process was converting the Python AST to LLVM IR.  With the AST interpreter, we can avoid this expensive process for the majority of our code.

AST interpreter diagrams
Old compilation flow
AST interpreter diagrams (1)
New compilation flow
The other selling point of the AST interpreter is that it will allow us to build “resume-at-any-point” functionality, which we need for our new tiering framework, which will in turn allow more aggressive speculations and optimizations.

Currently, though, the new AST interpreter is slower to execute than the LLVM interpreter — which was surprising to me, since the LLVM IR is quite low level and not designed for interpretation.  The LLVM interpreter does have a few advantages, though: 1) it happens after (very simple) type specialization, which means that it is able to elide dynamic dispatches, and 2) the pointer-based SSA in the LLVM IR is faster to manipulate than the string-based Python AST.

Thankfully, the AST interpreter is significantly faster to start up, as we hoped.  Unfortunately though, for one of the cases we were hoping to improve (sre_parse._parse), the function ends up being hot enough to escape the interpreter and incur the compilation cost.  As future work, we need to improve the performance of the interpreter so that we can keep more code in it, and also lower the overhead of our compilation tier.

In the works

The rough goal for the rest of the year is to start doing well on the rest of the PyPy benchmark suite.  The are two main parts to that:

– Be able to run all the benchmarks, and
  • Be able to run them quickly.

On the compatibility side, we need to support one more language construct (exec) and a number of additional extension modules.

On the performance front, there are two main things we’re focusing on.  The first is reducing our startup time, much of which comes currently from sre_parse._parse (via “import optparse”).  The AST interpreter is key to this, as well as some other things we’re going to work on such as swapping the LLVM register allocator.

The other performance aspect we’re working on is better speculations.  We have all the parts we need now (AST interpreter and frame introspection) so we have started working on a new tiering framework that will let us speculate on events such as integer non-overflow.

Unrelated to any benchmarks, we are also trying to get Pyston running on OSX.  We have a branch that builds, runs through startup, and then segfaults somewhere.  I’m currently working on getting a working debugger on OSX to continue the porting.


So, things are still moving quickly, but there’s still a lot to do!  I’ve kept the Github issues list up to date with available projects and tasks, and I created a new tracker task that lists the various benchmarks that we don’t support yet as well as what we need to get them running.  Please feel free to dive into any of them or to send an email to pyston-dev@pyston.org with any questions.

Frame introspection in Pyston

We recently landed a new feature for Pyston: frame introspection, the ability to inspect the local variables of stack frames (usually but not always the current one).  There are a couple ways to directly make use of this feature from your Python code, such as the locals() method and the f_locals attribute on frame objects.  There are also some Python features that aren’t explicitly about locals but require them to be available, such as eval() and exec statements.  Finally, frame introspection is important for the JIT to be able to introspect its own stack frames to be able to support features such as deoptimization.  (I should mention that none of these features work yet since they all depend on the base frame introspection mechanism, which only just got added.)

In interpreters, it can be relatively easy to support frame introspection since you will typically have a runtime structure that corresponds to all of local variables that are defined — this is how our interpreter tier works and adding frame introspection there wasn’t that difficult.  For our compiled tier, we don’t have any such runtime structure: all the Python locals get converted to C-style locals and end up in registers or spilled onto the stack.  We want to be able to locate all of our variables without affecting runtime performance or code generation, and to achieve this we used some new features of LLVM.

Patchpoints

Pyston makes extensive use of LLVM’s new “patchpoint” intrinsic.  If you’re curious, the documentation does a very good job of explaining what they are, but in short they provide two separate but related features: the ability to runtime-patch your generated code (which we use for inline caches), and the ability to receive the locations of runtime values as determined by the LLVM code generator, via “stackmaps”.  We were already making extensive use of the first feature to do runtime code patching for various purposes (a future blog post, perhaps), and now we started using the stackmap feature.  Our approach is pretty straightforward: for every callsite that might ever need frame introspection — which is essentially all of them — we attach all the local variables as stackmap arguments, and LLVM will generate a stackmap that tells us where those variables live during that callsite.  Then at runtime, we interpret the stackmap and locate the variables.

As you can guess, the practice was slightly harder than the theory.  While patchpoints have been quite robust for us in their common use, using them for all callsites exposed a number of bugs or missing features in LLVM’s implementation.  The first is that they did not support LLVM’s exception handling mechanisms, which we use to for Python-level exceptions — we added this and it is now in LLVM trunk.  We also had to add support for returning doubles from patchpoints (patch pending) and ran into an issue where we can’t use LLVM’s “i1” type to represent booleans for now.  There are also some issues where LLVM will tell us that a value exists in a caller-save register, which we will have to save ourselves since they will get clobbered; there’s an ongoing discussion about how to resolve that.

After working through those issues, we were able to pass all of our local and temporary variables through the stackmap to the runtime and run the locals() method.  The next issue was that the LLVM compilation times were quite prohibitive.  A quick profile showed that the register allocator was responsible for almost all of the time; FTL (Apple’s LLVM JIT for JavaScript) uses a simpler register allocator, which might work for us, but we ended up addressing this a different way.  The problem comes from the fact that we attach all local and temporary variables to the patchpoint, but we only clear out dead temporary variables at the end of a basic block.  This means that if you have even a moderately-large basic block, you accumulate many temporary variables (roughly one per subexpression), leading to an O(N^2) LLVM IR representation.

To fix this, we now clear out temporary variables within a basic block.  It means that we have to do slightly more work during the analysis phase, but the result is that there is practically no increase in runtime cost from turning on frame introspection and the associated extra LLVM IR.

Future work

As of this post, we have a working implementation of frame introspection, and one can call the locals() variable.  Now we can go and implement some of the features that depend on it, such as eval() and exec — though those are tricky to model, since local variable updates by eval() can sometimes be seen by the outer scope and sometimes not.  Try guessing what this will print:

x = 1
def f():
    print map(eval, ["x", "locals().items()", "[x for x in xrange(5)]", "x", "locals().items()"])
    print x
f()

In addition to features that we want to build on top of this, there are a number of related optimizations we can do.  For example, LLVM currently generates a separate stackmap per callsite, but for our uses, there is a fair amount of overlap between the different generated stackmaps (a spilled register will stay in the same stack slot), so we can store these more efficiently by doing some simple compression of the stackmaps.  Our frame introspection also invalidates a number of optimizations that we used to do, since to the optimizer, every value will tend to immediately escape.  In the long run, this is something that we need to have, and it enables more optimizations than it breaks so we are excited to have it.


Side note: what about standard debug info

LLVM already has an established mechanism for transmitting the locations of user source variables: this is something that any debugger will want of any language.  LLVM has a series of intrinsics that can encode this information, which flow through the code generator and end up being emitted as DWARF, the standard debug info format that (for example) GDB will read.  At first, it seems like a natural fit — we’re trying to do exactly what debug info is meant to do.  LLVM has pretty good support for debug info (as good as clang’s is), and it solves a number of problems for us such as the efficient encoding of variable locations in addition to hooking us into a widely used standard.

We tried going down that road with little success.  The problem is that Python has the requirement that all variables are always available through frame introspection.  If you’ve ever used GDB on an optimized program and seen something like “(value optimized out)”, you know that normal C/C++ debugging systems don’t guarantee this.  The problem is that guaranteed debug info can inhibit optimizations or cause extra work, and a very reasonable requirement of debug info is that the debug-enabled version has exactly the same code as the non-debug version.  So LLVM does enforce a strict requirement, but unfortunately one that is opposite from our needs: they guarantee that they will not do any extra work to make your debug info available.  Darnit.

One unfortunate conclusion of “not being able to use a non-pessimizing debug info scheme” is that our patchpoint approach does in fact hurt optimizations — by attaching the local variables to all callsites, we force variables to be live and computations to happen at certain points.  For instance, most static compilers for languages like C/C++ will optimize away dead definitions like “x = 7”, since there is no way to observe that they occurred.  In Python, unfortunately, a dead definition is observable since one can simply look at the locals and see it; in our approach, this translates to LLVM seeing that the variable being referenced by a patchpoint.  There are a number of ways we can reduce this penalty, such as by “materializing” the values at the time of frame introspection instead of constructing them eagerly at runtime.  We’ll keep an eye on this behavior and see how much such optimizations are necessary; my guess is that relatively little time is spent executing trivially-dead statements.